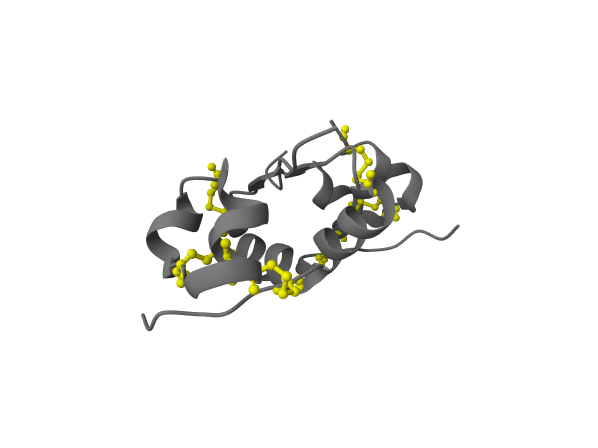
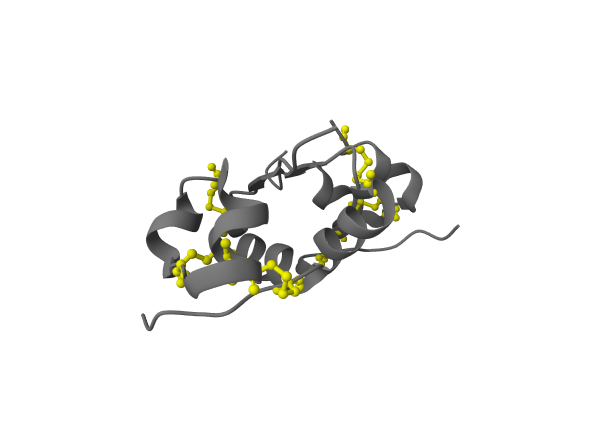
Load 4INS; protein as grey cartoon, and highlight the disulfide-bonded cysteines as yellow ball-and-stick.
Gemini used one elegant selector {label_comp_id:CYS}; the reference enumerates 12 cysteine components. Identical render.
What the grader scored vs what a human sees. MolBench uses an escalating grader: a fast scene-tree match, then a pixel-level visual diff, then a VLM judge for the ambiguous cases. Tree-match is a deliberately conservative approximation — the rendered image is the real ground truth. Each card below shows the reference and the model output with both scores, so you can judge whether the grader got it right.
{label_comp_id: CYS}) that the tree-grader couldn't recognize against a reference that enumerates every component — so MVS F1 collapses even though the render is pixel-identical.Load 4INS; protein as grey cartoon, and highlight the disulfide-bonded cysteines as yellow ball-and-stick.
Gemini used one elegant selector {label_comp_id:CYS}; the reference enumerates 12 cysteine components. Identical render.
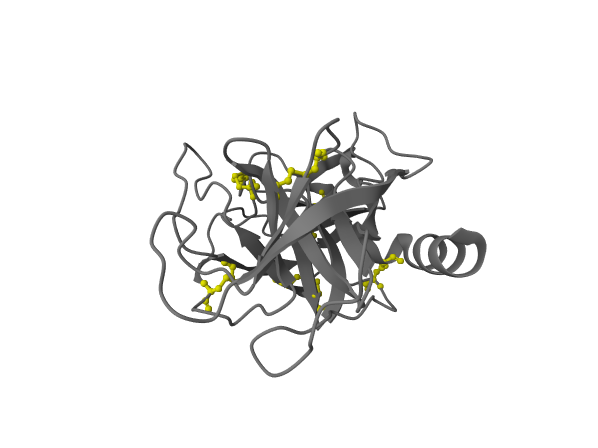
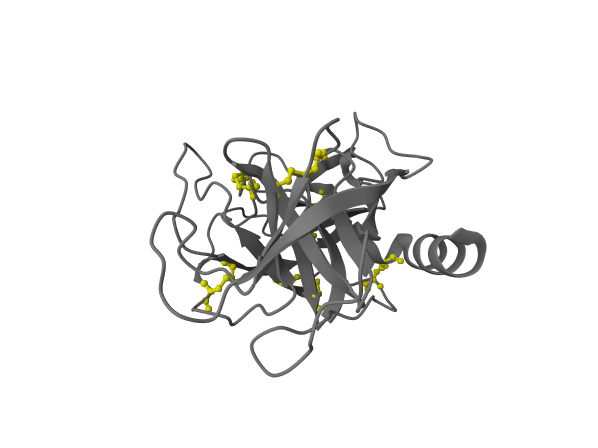
Load 3PTB; protein as grey cartoon, and highlight the disulfide-bonded cysteines as yellow ball-and-stick.
Same selector-elegance rescue as 4INS on trypsin.
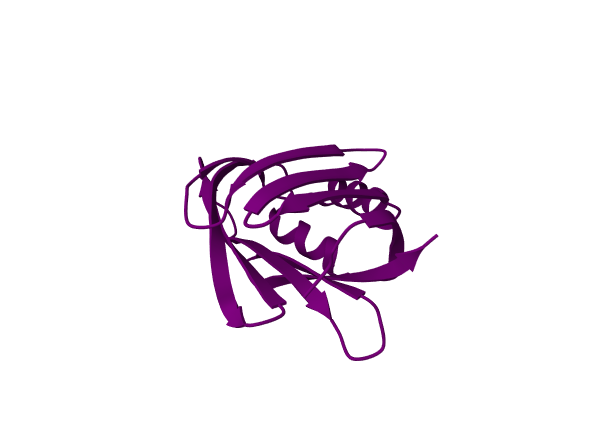
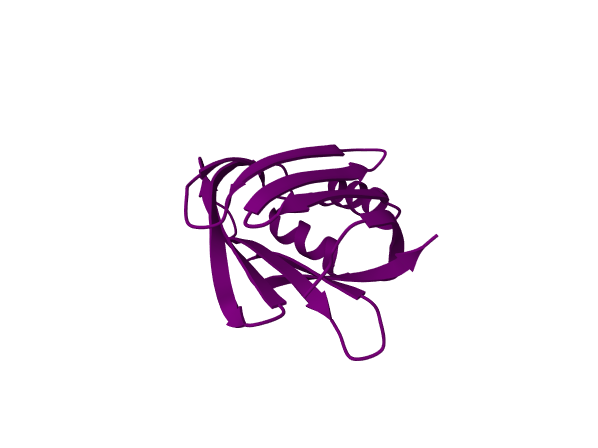
Load cellular retinoic-acid binding protein (1CBS) and show the protein as a purple cartoon.
Selector synonym (all vs polymer) on a single-chain protein.
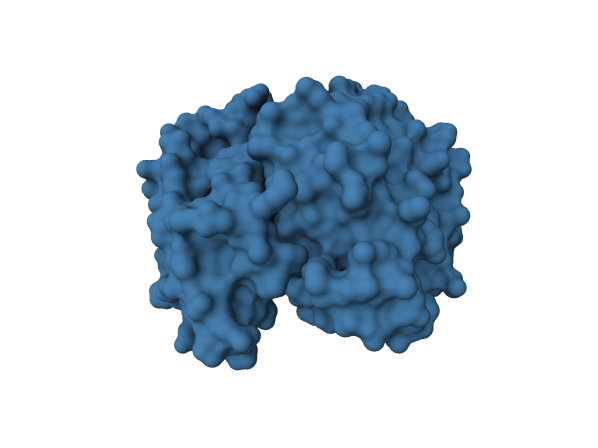
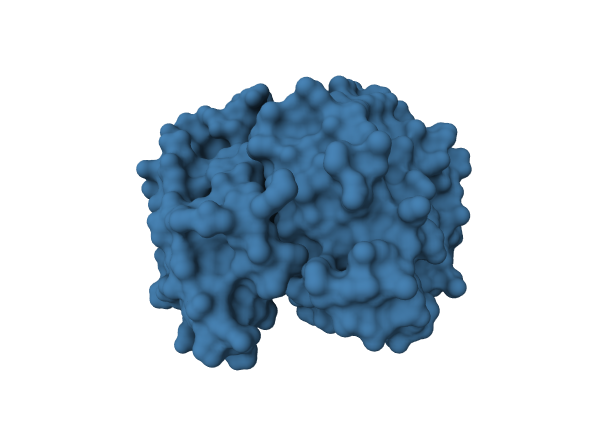
Load 1HHO; render the protein as a steelblue molecular surface.
Equivalent surface representation; tree penalised a default param.
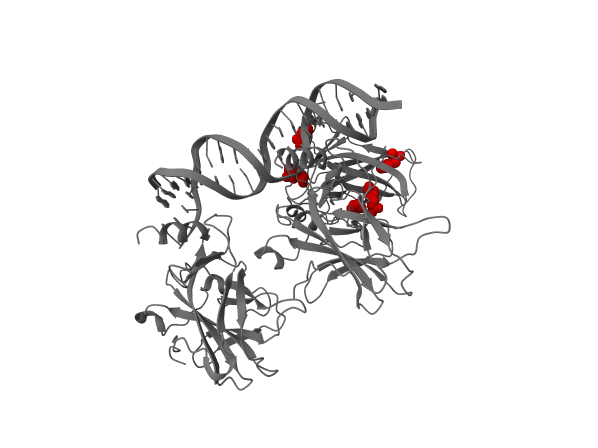
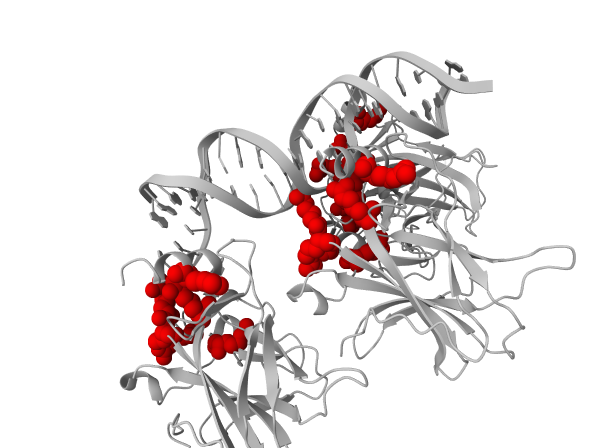
In p53 (PDB 1TUP), highlight the mutational hotspot residues — the positions carrying the most pathogenic ClinVar variants — as red spheres.
Same hotspot residues shown; camera/styling differ. VLM judged SAME.
VLM rationale: Both show the p53 protein-DNA complex with protein in gray cartoon and DNA double helix, and mutational hotspot residues highlighted as red spheres clustered near the protein-DNA interface. The representations, colors, and highlighted regions match; only camera angle and the apparent size/number of red spheres differ slightly.
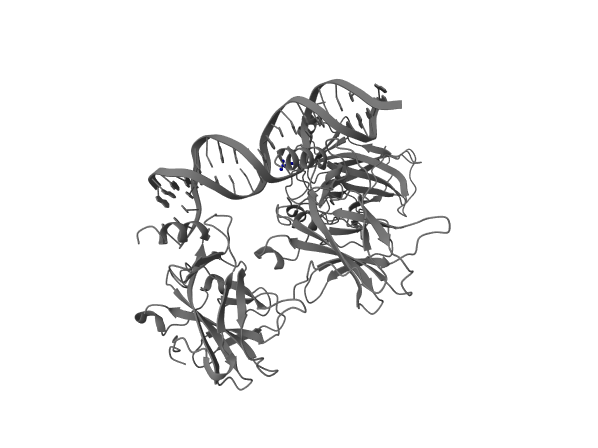
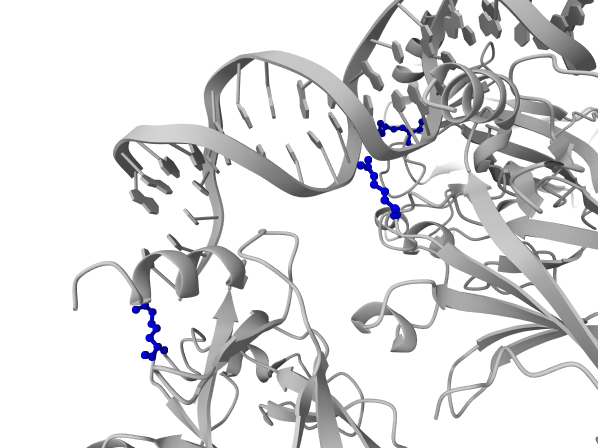
In p53 (PDB 1TUP), select the residue at canonical UniProt position 248 and show it as blue ball-and-stick.
Correct residue selected from another angle. VLM judged SAME.
VLM rationale: Both show the p53-DNA complex as gray cartoon with DNA double helix, and a residue highlighted in blue ball-and-stick representation at the protein-DNA interface. The output shows blue residues consistent with the highlighted position 248, matching the reference visualization style and colors.
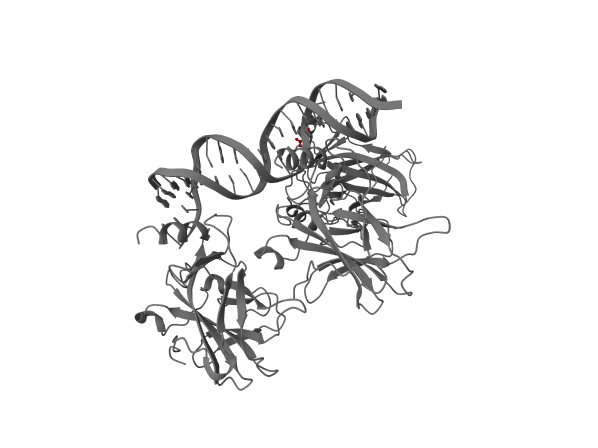
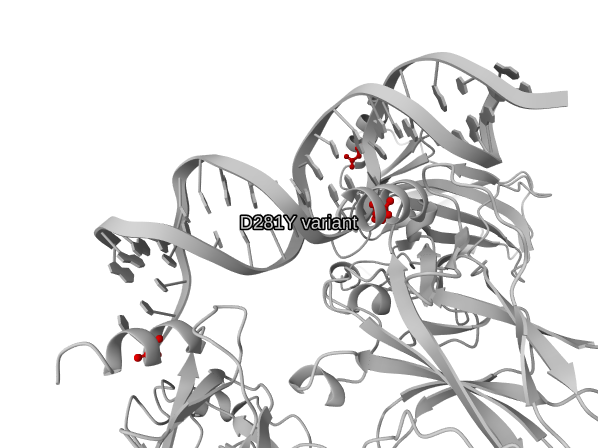
In p53 (PDB 1TUP), highlight the residue affected by the pathogenic ClinVar variant D281Y as red ball-and-stick.
Genuine divergence: VLM judged DIFFERENT. Cascade did NOT rescue.
VLM rationale: While both show the p53-DNA complex in grey cartoon with red highlighted residues, the output displays multiple red ball-and-stick residues in several locations (including one near the bottom and others near the DNA), plus a text label, whereas the reference shows a single highlighted residue at the DNA interface. The output does not match the single-residue D281Y highlight of the reference.
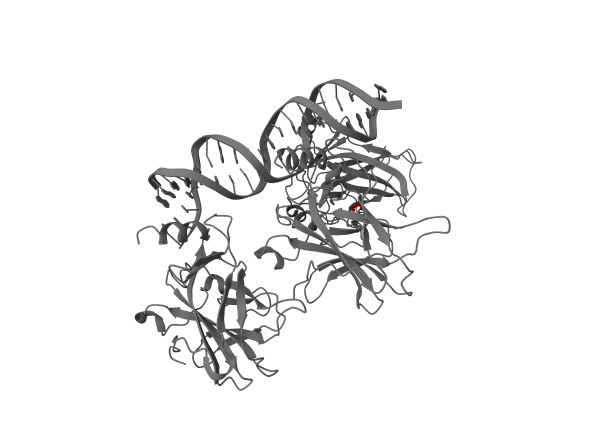
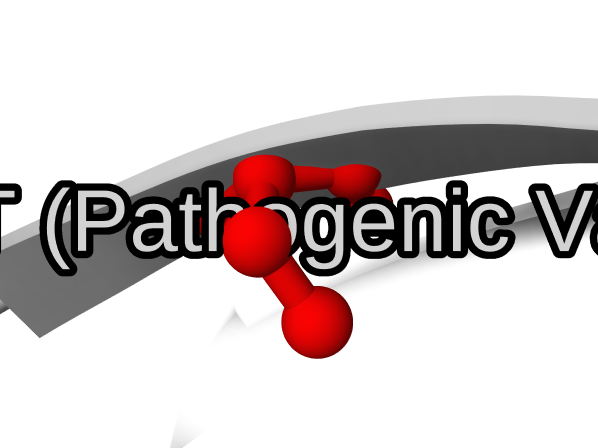
In p53 (PDB 1TUP), highlight the residue affected by the pathogenic ClinVar variant S215T as red ball-and-stick.
Clearest miss (lowest visual similarity). VLM DIFFERENT.
VLM rationale: The reference shows the full p53-DNA complex as a gray cartoon with a small red ball-and-stick residue highlighted. The output is a zoomed-in close-up showing only a red ball-and-stick molecule with large text overlay ('Pathogenic Va...'), lacking the protein cartoon, DNA, and overall structure context. It does not depict the same visualization.
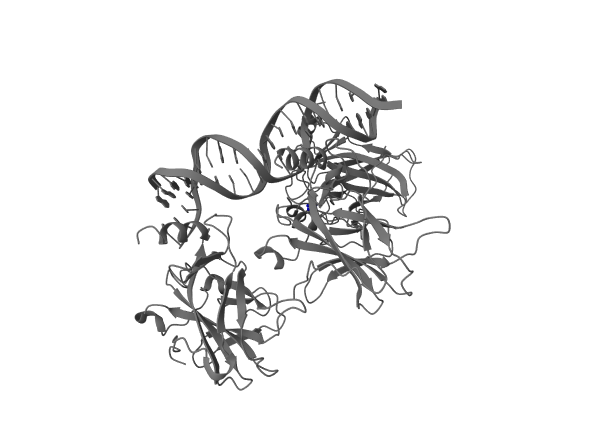
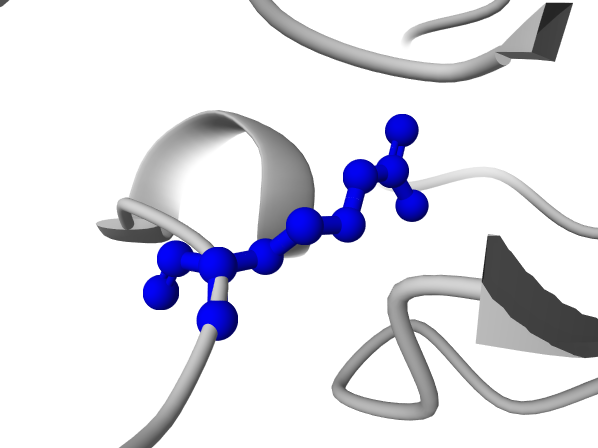
In p53 (PDB 1TUP), select the residue at canonical UniProt position 175 and show it as blue ball-and-stick.
p53 R175 hotspot; output differs. VLM DIFFERENT.
VLM rationale: The reference shows the full p53-DNA complex with cartoon protein and DNA double helix, with the residue 175 highlighted somewhere within. The output shows only a zoomed-in cartoon protein region with a blue ball-and-stick residue and no DNA visible. While both show a blue ball-and-stick residue, the highlighted residue appears to be a long-chain residue (like arginine) in the output, which is consistent with R175 in p53, but the overall scene/components differ substantially (no DNA shown). However, the core request element (blue ball-and-stick residue 175) is present. The discrepancy in shown components makes this borderline different.